financial planning bathurst

Gold is up!

Should I buy Gold as an investment?

Every now and then I get asked about gold as an investment. My view is that it is a speculative investment whose price is often driven up by fear and down by strong markets. You will have noticed some fear around recently I’m sure, and this has driven up the gold price to its current level of US$1,700 per ounce.

You may also be aware that the Australian dollar is currently very weak against the US dollar. So, if you are an investor in Australia and you hold gold, you have the added benefit of the currency rate further boosting your increase in investment value.So, if you bought gold in Australian dollars about a year ago you’d be pretty happy right now.

However, long term wealth creation requires your investments to perform well for decades at a time. When we build portfolios we adhere to a firm set of beliefs about long term market characteristics of a range of asset classes. Each asset class contributes something to the portfolio. Normally ‘growth’ or ‘stability’. We accept that risk and return are inextricably tied, so we balance the requirements of the client to build a portfolio that will perform at the highest level possible having regard to the volatility the client situation can withstand. Where possible, we take only the risk required to achieve the goal. Most of the assets we invest in also produce income in the form of dividends, rent or coupon payments. These inflows can be an income source for the client or be reinvested to compound our gains in the long run.

So, what is Gold’s role in all this? Is it a good growth asset?

Whilst, like any share or property, gold has periods where it’s performance well and truly beats the broader market, in the long run gold has performed poorly compared to other growth assets.

A long run chart below shows gold v global shares (growth assets) and Treasury Notes (defensive assets) over a 40-year period. As you can see, gold has not performed well compared to other growth assets.

Gold performance.jpg

So, perhaps gold is a defensive asset?

The only purpose for defensive assets is stability and liquidity. But gold has proven to be significantly more volatile than defensive assets such as Treasury Notes over a 30-year period with only a slight improvement in performance. It just doesn’t do what we need defensive assets to do. Couple the fluctuations in price with fluctuations in exchange rate and gold is much too volatile to hold as a defensive asset in the long run.

The graph below shows gold values in US and AUS dollars. As you can see, the exchange rate has a significant effect on the increases and decreases in value over time.

Gold Value in AUD.jpg

There’s another thing about gold. It doesn’t really do anything. It doesn’t produce anything, it doesn’t feed anyone, or cure anyone, it doesn’t pay an income in the form of a dividend or rent. Just under 80% of gold mined gets turned into jewellery. There is no question that is a growth area, with the significant majority heading to India and China. Nearly 20% ends up as bullion and only about 3% of gold goes into any form of technology, engineering or medicine etc. The only way gold as an investment will ever work for you is to buy it (at the right time), wait for it to go up and then sell it (at the right time), pay your transaction costs, pay your capital gains tax and then start looking for the next investment idea.

Summary

If you like the idea of owning a small amount of gold for a certain period of time as a speculative endeavour that’s great. If you got in three years ago and got out last week then you’ve done really well. But as a large component of a long-term investment portfolio we believe there are other, less speculative assets that will serve you better in the long run.

December Quarter Review

Economic Overview

The geopolitical risks that dominated for much of 2019 faded in Q4, supporting global share markets. Trade uncertainty faded with the US and China’s phase one trade deal announcement, while economic data remained stable. The trade deal, signed on January 15 means planned new tariffs will not be imposed, while US tariffs imposed in September on $120 billion Chinese goods will be reduced by half. The 25% tariffs on $250 billion of Chinese goods will remain. China also agreed to increase purchases of US goods, with agricultural produce highlighted.

The US Federal Reserve cut interest rates once in the quarter before indicating that “the current stance of monetary policy is appropriate”. The US economy expanded by 2.1% (annualised) in Q3. A result better than expected and stronger than Q2.

In the Eurozone, the confidence measure among German executives, improved in December, yet the Eurozone purchasing managers’ index remained unchanged at 50.6 in December – a level that indicates weak growth. Annual inflation was 1.0% in November, up from 0.7% in October but still well below the European Central Bank’s target of close to 2%. Christine Lagarde, in her first major speech as president of the European Central Bank, urged governments to boost public investment in order to increase domestic demand in Europe.

In the UK, the Latest GDP figures confirmed the economy had avoided entering a technical recession in the third quarter after contracting in the previous quarter. GDP growth was 0.4% quarter-on-quarter. Overall, the data suggests that the economy is coping with the uncertainty from Brexit. After the landslide election victory for the incumbent Conservative Party, the government is set to use its large majority to take the UK out of the EU by 31 January 2020, entering a transition period when the next stage of negotiations will begin

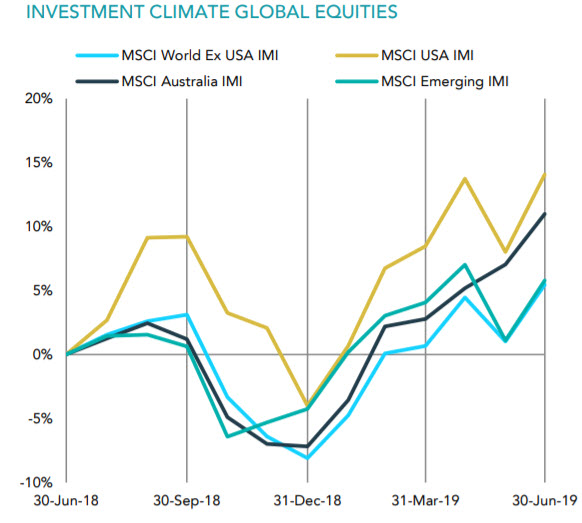
Global-Equity19.jpg

Japan’s economic data continued to show a significant divergence between the strength in service sectors and the weakness in manufacturing. There were also signs that the long-running trend towards an ever-tighter labour market had finally reached its natural limit. The main economic event for the quarter was the consumption tax increase on 1 October.

In Australia, the RBA cut the official cash rate to 0.75% in October. Despite predictions of further cuts, none eventuated during the quarter. Eyes now turn to the RBA’s first meeting in February. While the RBA noted in its December minutes that, “the Australian economy appears to have reached a gentle turning point” it also finished those minutes by noting, “the Board is prepared to ease monetary policy further if needed to support sustainable growth in the economy, full employment and the achievement of the inflation target over time.”

Market Overview

Asset Class Returns

The following outlines the returns across the various asset classes to the 31st December 2019

Dec-19Qtr-Returns.jpg

Overall, it was a mixed quarter to top off an extremely strong year. The majority of the Q4 gains came from global shares. US markets pushed higher as trade uncertainty faded, while Eurozone markets advanced with better economic data emerging from Germany. Bond markets reflected the better mood in the quarter as government bond yields rose (prices fell) and corporate bonds performed well.

Across the year it was hard to miss a good return, both Australian and global shares returned 20%+ returns, while Australian listed property was pushing 20% and fixed interest was given a shot in the arm as yields fell and prices increased. The asset class doing no one any favours? Cash.

In the US, the tech sector was a major beneficiary of easing trade tensions. Energy companies, which had lagged the broader S&P 500 index in 2019, rallied as the oil price rose on lower-than-expected supply.

Eurozone shares notched a strong return in the final quarter of the year, with the region’s MSCI EMU index returning 5.1%. Listed companies were supported by better economic data from Germany as well as the phase one trade deal agreed by the US and China. Gains were led by sectors that generally fare well when the economy is strengthening; top performing sectors included information technology, consumer discretionary and materials.

UK equities performed relatively well, and domestically focused areas benefited significantly as they responded favourably to the reduction in near-term political uncertainty.

The Japanese market rose in each month of the quarter to record a total return of 8.6%. Asia ex Japan delivered a strong return in Q4, supported by easing geopolitical risk as the US and China reached a phase one trade deal. US dollar weakness also provided support to returns. Against this backdrop China, South Korea and Taiwan all outperformed. In Taiwan, strong performance from technology sector companies boosted returns, as earnings expectations were revised upwards following solid Q3 sales figures

Emerging market shares posted a strong gain in Q4, benefiting from easing geopolitical concerns. The MSCI Emerging Markets Index increased in value and outperformed the MSCI World.

After a double digit first half of 2019, you might say the ASX coasted home with lower returns in Q3 and a meek 0.75% return for Q4. Notably, it did pass its previous record high in November. Q4 was hampered by a weak December with concerns over Christmas retail figures, the strengthening Australian dollar and improving employment figures, which paradoxically became a negative with the ASX counting on the support of further interest rate cuts. Meanwhile, three of the four big banks, NAB, ANZ and Westpac, struggled through Q4 with either more scandal or cuts to earnings and dividends, proving another drag for the ASX in Q4.

2019 Take outs

As we’ve noted, it was hard to go wrong in 2019, unless you had a bank account stuffed with cash or a poorly diversified portfolio stuffed with bank shares – or worse, a combination of both! Major asset classes all delivered stellar returns and when combined into a balanced portfolio of 60% growth assets/40% defensive assets the return was 16.74% for 2019, after a 1.01% return in 2018. Remarkably, the 2017 return for such a portfolio was 8.17% and the 2016 return 8.01%.

How reliable is that consistency? The average annual return for this portfolio is 8.27% for the past decade. The worst return came in 2011 with a -1.00% return, with 2019 being the best. Which shows if you’re prepared to ride out the sub-par years the realignment can eventuate, along with the rewards.

Balanced-Decade.jpg

The on again off again trade tensions have proven somewhat farcical. A sniff of negative would take the market down and a whiff of positive would drag it back upwards. When the trade issues move into the background it will be interesting where global markets will take their cues from next. The US presidential race will likely be a focus. Just remember 2016 and the damage Donald Trump was supposedly going to inflict on world markets.

Whatever the focus, it should remain as a matter of interest, not a matter of concern. 2019 was a reminder that we should never react because our expectations may not align with market responses. There was significant concern as 2018 ended. Economic momentum was slowing, earnings growth was in question and optimism was low.

2019 returns were unexpected and more than anyone could hope for.

Does it mean anything for 2020? No. 2020 will have no memory of 2019, just as 2019 had no memory of 2018.

June Quarter Review

Economic Overview

It was a quarter of all-time highs in Q2 2019 as both the US S&P 500 index and Australia’s ASX All Ordinaries achieved new record highs, albeit with very different time frames between their past record highs and their new record highs. Most developed markets posted good returns during the quarter, despite some May declines. For the most part it seemed to be accommodating language from central banks helping underpin share market gains.

Uncertainty surrounding the US’ trade stance caused a May market wobble. However, investors were soon re-encouraged by continued dovishness from the Federal Reserve and indications of progress in trade tensions by the end of June. Comments from President Trump that his administration could impose tariffs on Mexican imports and extend the suite of goods that are taxed on import from China, caused a sharp market sell-off in May. In June, signs emerged of progress in talks with China, with Trump also “indefinitely suspending” the Mexican tariffs.

Eurozone Q1 GDP growth for was confirmed at 0.4% quarter-on-quarter. Annual inflation for June was stable compared to May at 1.2%. European Central Bank President Mario Draghi hinted that further monetary policy easing, such as new bond purchases, could be on the way if the eurozone inflation outlook fails to improve.

In the UK Theresa May resigned as leader of the Conservative Party and UK prime minister, taking a caretaker role on June 7th. The Conservative Party began the process of selecting its new leader. Despite a further extension of the Article 50 deadline to 31 October, there remains considerable uncertainty as to the path a new leader might wish to take. The negative impact of the original 31 March Article 50 deadline on the UK manufacturing sector became clearer. While GDP grew by 0.5% in Q1, in line with expectations, the Office for National Statistics revealed that the economy shrank by 0.4% in April, primarily due to a sharp fall in car production.

In Japan economic data was mixed, with the largest positive surprise seen in Japan’s growth rate for Q1 2019. This showed real GDP grew at an annualised rate of 2.1% whereas consensus expectations had called for a decline. The Bank of Japan left monetary policy, and the associated language, unchanged in the quarter.

In Australia, the LNP coalition surprised many pundits by retaining government during the May election. The election was followed by a sharp dose of economic reality as the Reserve Bank cut interest rates to a record low of 1.25%, noting domestic uncertainty stemming from household consumption. After being in a constant freefall since mid-2017, house prices appeared to stabilise in Melbourne and Sydney during June with 0.2% and 0.1% gains respectively for the month. Across Australia prices combined to fall 0.1% for the month and 1% for the quarter.

Market Overview

Asset Class Returns

The following outlines the returns across the various asset classes to the 30th June 2019.

Market Rerturns 2019

US shares gained in Q2 and the S&P 500 set a new record high. More cyclical areas of the market, i.e. those that are most sensitive to the economic cycle, generally performed strongly. Financials, materials and IT all generated robust gains. Healthcare remains challenged by potential changes to pricing legislation, and more defensive (ie less cyclical) areas of the market made modest gains. Energy stocks largely declined.

Eurozone shares advanced in Q2 with a sharp drop in May sandwiched in between gains in April and June. Top performing sectors included information technology (IT), consumer discretionary and industrials. Sentiment towards trade-exposed areas of the market such as semiconductors and car makers ebbed and flowed over the quarter as trade tensions persisted. The lack of any further escalation in the trade wars in June helped the market to recover after May’s pull-back. UK shares also performed well. Areas of the market perceived to offer superior and defensible earnings growth extended the run of outperformance they have experienced since the beginning of 2019.

Returns 2019

Japanese shares performed worse than the other main developed markets in the second quarter. The total return for the three months was -2.4%, primarily as a result of weakness in May. The yen strengthened against other major currencies, driven partly by its perceived safe-haven status at times of geopolitical risk, and partly as a result of changing interest rate expectations for the US.

Emerging market shares recorded a slight gain in a volatile second quarter. US-China trade tensions were rekindled in May as talks unexpectedly broke down, and both sides implemented new tariffs. However, hopes for a resumption of talks post the G20 summit in June, and rising expectations that the US Fed will cut interest rates, proved supportive later in the period. The MSCI Emerging Markets Index gained but underperformed the MSCI World.

In Australia

Back in Australia, the price index of the ASX All Ordinaries finally surpassed its previous high reached back in October 2007.  The Australian market was among the top performers globally, returning nearly 8% over the quarter and more than 11% for the financial year. The iron ore price continued to power the shareprices of major miners, BHP, Rio Tinto and Fortescue, while the market’s big dividend payers staged a relief rally in May as the prospect of Labor’s dividend imputation changes went away with Labor’s failure to win the Federal election.

Additional material sourced from Schroders and DFA Australia.

This material is provided for information only. No account has been taken of the objectives, financial situation or needs of any particular person or entity. Accordingly, to the extent that this material may constitute general financial product advice, investors should, before acting on the advice, consider the appropriateness of the advice, having regard to the investor’s objectives, financial situation and needs. This is not an offer or recommendation to buy or sell securities or other financial products, nor a solicitation for deposits or other business, whether directly or indirectly.


"Stock Markets Crash" - Let's get some clicks on our website....

Well, it’s happened, or it’s happening. The correction that we’ve been told has been coming every month since January 2017, arrived. It's been great for getting clicks on websites and selling a few newspapers (do they still print those). Billions 'WIPED OFF' the market! The billions that have been wiped off so far were only WIPED ON since November last year.

Is it over? Probably not, but so far it's quite normal and unexciting.

Normal?

Yes normal. 2017 was an extremely rare year where the entrants to world equity markets enjoyed a free pass to the park and none of the rides had any bumps, jumps or scares. The biggest decline happened early in 2017 and then equity markets happily chugged upwards

How should you deal with this correction? Well it depends on your investment time-frame and your personal objectives, but for most people, you should ignore it.

Like all downward movements there are the regular tea leaf readings, inferences about past crash behaviour being an indicator of the future along with the unveiling of scary stats and charts reminding us of uncharted territory. I particularly like it when those holding gold start screaming that the end of the capitalist world is coming.

In other words, we’re expected to believe it’s eerily similar to 1987, 2008 and the great depression, but it has the possibility to be much worse!

Last Friday’s fall on the Dow Jones was 666 points. Tuesday’s fall was 1175 points. Ouch! To put that fall in some sort of perspective, the Dow Jones wasn’t even worth 1175 points until April 1983. 35 years later the whole weight of that index is a 4.6% daily loss.

Could a correction become a bear market or a crash? Always possible. However, time has shown almost no corrections go further to become crashes. Given enough time, most turn into buying opportunities.

It’s usually a recession that sets off serious bad times in equities. So why are sharemarkets falling when we have the opposite economic conditions in the world’s biggest economy? It’s because investors are reacting to what that growing economy means – inflation and interest rate increases.

Rates fell to historic lows in the financial crisis and have only recently started to rebound. Low rates make investors turn away from fixed interest and cash to embrace shares. With the ‘risk free rate’ rising, shares get re-priced such that the ‘equity premium’ (the extra you get for taking on the risk of shares instead of fixed interest and term deposits) is maintained.

At the same time, an expanding economy means companies will expect greater long-term growth and will expect corporate profits to remain robust.

As usual, if the rough times aren’t over, don’t sell the good stuff that have served you well in hopes of avoiding market carnage. If you are inclined to, remember there is no way you’ll know when to buy again. Despite a correction often being the best time to buy, many investors don’t have the fortitude to don their floaties and enter the choppy water to grab a bargain.

Last year’s stability was an anomaly. Now it’s back to normal programming.


This represents general information only. Before making any financial or investment decisions, we recommend you consult a financial planner to take into account your personal investment objectives, financial situation and individual needs.

Ethical Organisations and Individuals - You must have both!

I saw a presentation from Major General Jim Molan yesterday about ethical leadership. Amongst many other things, Jim Molan was the Chief of Operations for the multinational Forces in Iraq in 2004. As you can imagine, leading forces in Iraq posed many management and ethical issues.

One of his key statements was that for ethical conduct to be assured, an ethical view must be held by both the organisation and the individuals within it. If either fail, the outcome will be compromised.

From a financial planning point of view I take two things from this:

1.       The importance of our organisation being actively and visibly ethical to ensure the people within it can and will act in our clients’ best interests at all times, and

2.       That regardless of how dedicated and pure of heart an individual planner is, if they work for an organisation that rewards bad behaviour in order to achieve it's own goals, that is what you are going get.


As a privately owned financial planning company, we tend to go on and on about being ‘non-conflicted’. This means we are one of the 15% of financial planners in Australia (and Bathurst) that aren’t controlled by the big four banks or AMP. This means we don’t have sales targets, we don’t share ownership with any fund managers, platform providers or insurance companies. We don’t have a share price to think about and no-one exerts any pressure on us in terms of volume or revenue. We answer to no-one but our clients. This makes an enormous difference in the advice we give.


Thanks Jim!