stockmarket

The Magic of Timing the Market

Lately the stock market has been the topic of conversation amongst many people. I have one friend who kindly always makes sure he tells me when someone gives him the tip that the stock market is about to crash. I always ask him “Could he please tell us what day, week or even month it is going to happen. I need to know when in order for it to be useful information”. I also explain that I will also need to know when it has reached the bottom, because I will need to know when to buy back in to reap the rewards from this information. So far, whoever is giving him the tips has been unable to provide the timing information that we need.

Buying investments or switching between different asset classes at the right time is very difficult. History has shown that doing it reliably and repeatedly is next to impossible.

There is a misconception that some people are “in the know” and can therefore buy low and sell high at just the right moment. What most people fail to appreciate is that each day an average of $450 billion of equity trading occurs around the world. The vast majority of this training is undertaken by stockbrokers, fund managers and analysts that are very much “in the know”. All these “in the know” people are competing against each other to make profits, whilst charging their clients for the work they are doing. Each time one outperforms the market, one under-performs the market by the same margin. That’s a mathematical fact. The net result is that half of the people “in the know” do better than the market and half of them do worse than the market in any given week, month or year. Ahaa!! I’ve got it! If we could work out which of the “in the know” people were going to beat the market this year we could make some great returns... If we knew that we would really be “in the know” wouldn’t we!

Unfortunately, research shows that the chance of any one particular money manager beating the market 5 years in a row is about the same as the chance of flipping 5 heads in a row with a coin (about 3%). And that’s before you factor in the fees that the money manager (quite justifiably) charges for doing his or her work. Factor in fees of just 1% and the money manager’s chances are well under 1%.

So I believe the best strategy is to deal with a manager with a good track record of regular, consistent flipping, but someone that charges you the least for each flip of the coin and you’ll do better.

There’s an issue of course. And the issue is that all money managers are doing it for a living and are trying to charge what they can. I do not begrudge anyone charging for their time and effort. So when our 1% miracle manager flips 5 heads in a row he (or she) tends to make hay while the sun shines, knowing that they may very well flip 5 tails over the next 5 years! So they charge a premium for their ‘proven’ coin flipping skills whist they can get it which reduces the returns for the investor even further. You can bet pretty safely that if you seek out the “best performing funds of the last 5 years” you will be paying a premium with no greater chance of success than if you just stick with the manager you used last year providing his or her fees are reasonable.

History has shown that the best way to get great returns is to invest across a considered range of assets taking into account your objectives, take a long-term view and focus on keeping costs low.

This means avoiding trading costs, avoiding realised capital gains and finding investments with efficient fees. It means having an overall strategy that reduces tax, harnesses the long term returns from the companies and properties of the world and manages risks.

Needless to say, that’s what we do here! If you’d like to deal with someone that generates income from great strategy and financial education rather than from selling any particular products or investments then we’d love to hear from you.

June Quarter Review

Economic Overview

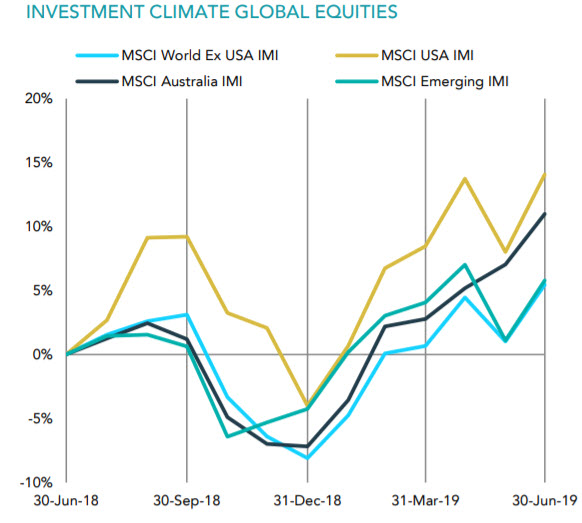
It was a quarter of all-time highs in Q2 2019 as both the US S&P 500 index and Australia’s ASX All Ordinaries achieved new record highs, albeit with very different time frames between their past record highs and their new record highs. Most developed markets posted good returns during the quarter, despite some May declines. For the most part it seemed to be accommodating language from central banks helping underpin share market gains.

Uncertainty surrounding the US’ trade stance caused a May market wobble. However, investors were soon re-encouraged by continued dovishness from the Federal Reserve and indications of progress in trade tensions by the end of June. Comments from President Trump that his administration could impose tariffs on Mexican imports and extend the suite of goods that are taxed on import from China, caused a sharp market sell-off in May. In June, signs emerged of progress in talks with China, with Trump also “indefinitely suspending” the Mexican tariffs.

Eurozone Q1 GDP growth for was confirmed at 0.4% quarter-on-quarter. Annual inflation for June was stable compared to May at 1.2%. European Central Bank President Mario Draghi hinted that further monetary policy easing, such as new bond purchases, could be on the way if the eurozone inflation outlook fails to improve.

In the UK Theresa May resigned as leader of the Conservative Party and UK prime minister, taking a caretaker role on June 7th. The Conservative Party began the process of selecting its new leader. Despite a further extension of the Article 50 deadline to 31 October, there remains considerable uncertainty as to the path a new leader might wish to take. The negative impact of the original 31 March Article 50 deadline on the UK manufacturing sector became clearer. While GDP grew by 0.5% in Q1, in line with expectations, the Office for National Statistics revealed that the economy shrank by 0.4% in April, primarily due to a sharp fall in car production.

In Japan economic data was mixed, with the largest positive surprise seen in Japan’s growth rate for Q1 2019. This showed real GDP grew at an annualised rate of 2.1% whereas consensus expectations had called for a decline. The Bank of Japan left monetary policy, and the associated language, unchanged in the quarter.

In Australia, the LNP coalition surprised many pundits by retaining government during the May election. The election was followed by a sharp dose of economic reality as the Reserve Bank cut interest rates to a record low of 1.25%, noting domestic uncertainty stemming from household consumption. After being in a constant freefall since mid-2017, house prices appeared to stabilise in Melbourne and Sydney during June with 0.2% and 0.1% gains respectively for the month. Across Australia prices combined to fall 0.1% for the month and 1% for the quarter.

Market Overview

Asset Class Returns

The following outlines the returns across the various asset classes to the 30th June 2019.

Market Rerturns 2019

US shares gained in Q2 and the S&P 500 set a new record high. More cyclical areas of the market, i.e. those that are most sensitive to the economic cycle, generally performed strongly. Financials, materials and IT all generated robust gains. Healthcare remains challenged by potential changes to pricing legislation, and more defensive (ie less cyclical) areas of the market made modest gains. Energy stocks largely declined.

Eurozone shares advanced in Q2 with a sharp drop in May sandwiched in between gains in April and June. Top performing sectors included information technology (IT), consumer discretionary and industrials. Sentiment towards trade-exposed areas of the market such as semiconductors and car makers ebbed and flowed over the quarter as trade tensions persisted. The lack of any further escalation in the trade wars in June helped the market to recover after May’s pull-back. UK shares also performed well. Areas of the market perceived to offer superior and defensible earnings growth extended the run of outperformance they have experienced since the beginning of 2019.

Returns 2019

Japanese shares performed worse than the other main developed markets in the second quarter. The total return for the three months was -2.4%, primarily as a result of weakness in May. The yen strengthened against other major currencies, driven partly by its perceived safe-haven status at times of geopolitical risk, and partly as a result of changing interest rate expectations for the US.

Emerging market shares recorded a slight gain in a volatile second quarter. US-China trade tensions were rekindled in May as talks unexpectedly broke down, and both sides implemented new tariffs. However, hopes for a resumption of talks post the G20 summit in June, and rising expectations that the US Fed will cut interest rates, proved supportive later in the period. The MSCI Emerging Markets Index gained but underperformed the MSCI World.

In Australia

Back in Australia, the price index of the ASX All Ordinaries finally surpassed its previous high reached back in October 2007.  The Australian market was among the top performers globally, returning nearly 8% over the quarter and more than 11% for the financial year. The iron ore price continued to power the shareprices of major miners, BHP, Rio Tinto and Fortescue, while the market’s big dividend payers staged a relief rally in May as the prospect of Labor’s dividend imputation changes went away with Labor’s failure to win the Federal election.

Additional material sourced from Schroders and DFA Australia.

This material is provided for information only. No account has been taken of the objectives, financial situation or needs of any particular person or entity. Accordingly, to the extent that this material may constitute general financial product advice, investors should, before acting on the advice, consider the appropriateness of the advice, having regard to the investor’s objectives, financial situation and needs. This is not an offer or recommendation to buy or sell securities or other financial products, nor a solicitation for deposits or other business, whether directly or indirectly.


"Stock Markets Crash" - Let's get some clicks on our website....

Well, it’s happened, or it’s happening. The correction that we’ve been told has been coming every month since January 2017, arrived. It's been great for getting clicks on websites and selling a few newspapers (do they still print those). Billions 'WIPED OFF' the market! The billions that have been wiped off so far were only WIPED ON since November last year.

Is it over? Probably not, but so far it's quite normal and unexciting.

Normal?

Yes normal. 2017 was an extremely rare year where the entrants to world equity markets enjoyed a free pass to the park and none of the rides had any bumps, jumps or scares. The biggest decline happened early in 2017 and then equity markets happily chugged upwards

How should you deal with this correction? Well it depends on your investment time-frame and your personal objectives, but for most people, you should ignore it.

Like all downward movements there are the regular tea leaf readings, inferences about past crash behaviour being an indicator of the future along with the unveiling of scary stats and charts reminding us of uncharted territory. I particularly like it when those holding gold start screaming that the end of the capitalist world is coming.

In other words, we’re expected to believe it’s eerily similar to 1987, 2008 and the great depression, but it has the possibility to be much worse!

Last Friday’s fall on the Dow Jones was 666 points. Tuesday’s fall was 1175 points. Ouch! To put that fall in some sort of perspective, the Dow Jones wasn’t even worth 1175 points until April 1983. 35 years later the whole weight of that index is a 4.6% daily loss.

Could a correction become a bear market or a crash? Always possible. However, time has shown almost no corrections go further to become crashes. Given enough time, most turn into buying opportunities.

It’s usually a recession that sets off serious bad times in equities. So why are sharemarkets falling when we have the opposite economic conditions in the world’s biggest economy? It’s because investors are reacting to what that growing economy means – inflation and interest rate increases.

Rates fell to historic lows in the financial crisis and have only recently started to rebound. Low rates make investors turn away from fixed interest and cash to embrace shares. With the ‘risk free rate’ rising, shares get re-priced such that the ‘equity premium’ (the extra you get for taking on the risk of shares instead of fixed interest and term deposits) is maintained.

At the same time, an expanding economy means companies will expect greater long-term growth and will expect corporate profits to remain robust.

As usual, if the rough times aren’t over, don’t sell the good stuff that have served you well in hopes of avoiding market carnage. If you are inclined to, remember there is no way you’ll know when to buy again. Despite a correction often being the best time to buy, many investors don’t have the fortitude to don their floaties and enter the choppy water to grab a bargain.

Last year’s stability was an anomaly. Now it’s back to normal programming.


This represents general information only. Before making any financial or investment decisions, we recommend you consult a financial planner to take into account your personal investment objectives, financial situation and individual needs.