The Magic of Timing the Market

Lately the stock market has been the topic of conversation amongst many people. I have one friend who kindly always makes sure he tells me when someone gives him the tip that the stock market is about to crash. I always ask him “Could he please tell us what day, week or even month it is going to happen. I need to know when in order for it to be useful information”. I also explain that I will also need to know when it has reached the bottom, because I will need to know when to buy back in to reap the rewards from this information. So far, whoever is giving him the tips has been unable to provide the timing information that we need.

Buying investments or switching between different asset classes at the right time is very difficult. History has shown that doing it reliably and repeatedly is next to impossible.

There is a misconception that some people are “in the know” and can therefore buy low and sell high at just the right moment. What most people fail to appreciate is that each day an average of $450 billion of equity trading occurs around the world. The vast majority of this training is undertaken by stockbrokers, fund managers and analysts that are very much “in the know”. All these “in the know” people are competing against each other to make profits, whilst charging their clients for the work they are doing. Each time one outperforms the market, one under-performs the market by the same margin. That’s a mathematical fact. The net result is that half of the people “in the know” do better than the market and half of them do worse than the market in any given week, month or year. Ahaa!! I’ve got it! If we could work out which of the “in the know” people were going to beat the market this year we could make some great returns... If we knew that we would really be “in the know” wouldn’t we!

Unfortunately, research shows that the chance of any one particular money manager beating the market 5 years in a row is about the same as the chance of flipping 5 heads in a row with a coin (about 3%). And that’s before you factor in the fees that the money manager (quite justifiably) charges for doing his or her work. Factor in fees of just 1% and the money manager’s chances are well under 1%.

So I believe the best strategy is to deal with a manager with a good track record of regular, consistent flipping, but someone that charges you the least for each flip of the coin and you’ll do better.

There’s an issue of course. And the issue is that all money managers are doing it for a living and are trying to charge what they can. I do not begrudge anyone charging for their time and effort. So when our 1% miracle manager flips 5 heads in a row he (or she) tends to make hay while the sun shines, knowing that they may very well flip 5 tails over the next 5 years! So they charge a premium for their ‘proven’ coin flipping skills whist they can get it which reduces the returns for the investor even further. You can bet pretty safely that if you seek out the “best performing funds of the last 5 years” you will be paying a premium with no greater chance of success than if you just stick with the manager you used last year providing his or her fees are reasonable.

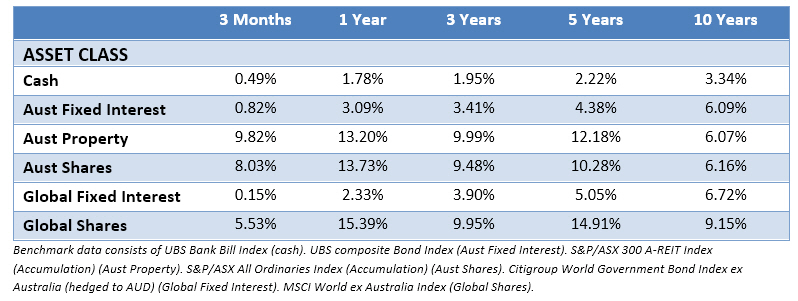
History has shown that the best way to get great returns is to invest across a considered range of assets taking into account your objectives, take a long-term view and focus on keeping costs low.

This means avoiding trading costs, avoiding realised capital gains and finding investments with efficient fees. It means having an overall strategy that reduces tax, harnesses the long term returns from the companies and properties of the world and manages risks.

Needless to say, that’s what we do here! If you’d like to deal with someone that generates income from great strategy and financial education rather than from selling any particular products or investments then we’d love to hear from you.

June Quarter Review

Economic Overview

It was a quarter of all-time highs in Q2 2019 as both the US S&P 500 index and Australia’s ASX All Ordinaries achieved new record highs, albeit with very different time frames between their past record highs and their new record highs. Most developed markets posted good returns during the quarter, despite some May declines. For the most part it seemed to be accommodating language from central banks helping underpin share market gains.

Uncertainty surrounding the US’ trade stance caused a May market wobble. However, investors were soon re-encouraged by continued dovishness from the Federal Reserve and indications of progress in trade tensions by the end of June. Comments from President Trump that his administration could impose tariffs on Mexican imports and extend the suite of goods that are taxed on import from China, caused a sharp market sell-off in May. In June, signs emerged of progress in talks with China, with Trump also “indefinitely suspending” the Mexican tariffs.

Eurozone Q1 GDP growth for was confirmed at 0.4% quarter-on-quarter. Annual inflation for June was stable compared to May at 1.2%. European Central Bank President Mario Draghi hinted that further monetary policy easing, such as new bond purchases, could be on the way if the eurozone inflation outlook fails to improve.

In the UK Theresa May resigned as leader of the Conservative Party and UK prime minister, taking a caretaker role on June 7th. The Conservative Party began the process of selecting its new leader. Despite a further extension of the Article 50 deadline to 31 October, there remains considerable uncertainty as to the path a new leader might wish to take. The negative impact of the original 31 March Article 50 deadline on the UK manufacturing sector became clearer. While GDP grew by 0.5% in Q1, in line with expectations, the Office for National Statistics revealed that the economy shrank by 0.4% in April, primarily due to a sharp fall in car production.

In Japan economic data was mixed, with the largest positive surprise seen in Japan’s growth rate for Q1 2019. This showed real GDP grew at an annualised rate of 2.1% whereas consensus expectations had called for a decline. The Bank of Japan left monetary policy, and the associated language, unchanged in the quarter.

In Australia, the LNP coalition surprised many pundits by retaining government during the May election. The election was followed by a sharp dose of economic reality as the Reserve Bank cut interest rates to a record low of 1.25%, noting domestic uncertainty stemming from household consumption. After being in a constant freefall since mid-2017, house prices appeared to stabilise in Melbourne and Sydney during June with 0.2% and 0.1% gains respectively for the month. Across Australia prices combined to fall 0.1% for the month and 1% for the quarter.

Market Overview

Asset Class Returns

The following outlines the returns across the various asset classes to the 30th June 2019.

Market Rerturns 2019

US shares gained in Q2 and the S&P 500 set a new record high. More cyclical areas of the market, i.e. those that are most sensitive to the economic cycle, generally performed strongly. Financials, materials and IT all generated robust gains. Healthcare remains challenged by potential changes to pricing legislation, and more defensive (ie less cyclical) areas of the market made modest gains. Energy stocks largely declined.

Eurozone shares advanced in Q2 with a sharp drop in May sandwiched in between gains in April and June. Top performing sectors included information technology (IT), consumer discretionary and industrials. Sentiment towards trade-exposed areas of the market such as semiconductors and car makers ebbed and flowed over the quarter as trade tensions persisted. The lack of any further escalation in the trade wars in June helped the market to recover after May’s pull-back. UK shares also performed well. Areas of the market perceived to offer superior and defensible earnings growth extended the run of outperformance they have experienced since the beginning of 2019.

Returns 2019

Japanese shares performed worse than the other main developed markets in the second quarter. The total return for the three months was -2.4%, primarily as a result of weakness in May. The yen strengthened against other major currencies, driven partly by its perceived safe-haven status at times of geopolitical risk, and partly as a result of changing interest rate expectations for the US.

Emerging market shares recorded a slight gain in a volatile second quarter. US-China trade tensions were rekindled in May as talks unexpectedly broke down, and both sides implemented new tariffs. However, hopes for a resumption of talks post the G20 summit in June, and rising expectations that the US Fed will cut interest rates, proved supportive later in the period. The MSCI Emerging Markets Index gained but underperformed the MSCI World.

In Australia

Back in Australia, the price index of the ASX All Ordinaries finally surpassed its previous high reached back in October 2007.  The Australian market was among the top performers globally, returning nearly 8% over the quarter and more than 11% for the financial year. The iron ore price continued to power the shareprices of major miners, BHP, Rio Tinto and Fortescue, while the market’s big dividend payers staged a relief rally in May as the prospect of Labor’s dividend imputation changes went away with Labor’s failure to win the Federal election.

Additional material sourced from Schroders and DFA Australia.

This material is provided for information only. No account has been taken of the objectives, financial situation or needs of any particular person or entity. Accordingly, to the extent that this material may constitute general financial product advice, investors should, before acting on the advice, consider the appropriateness of the advice, having regard to the investor’s objectives, financial situation and needs. This is not an offer or recommendation to buy or sell securities or other financial products, nor a solicitation for deposits or other business, whether directly or indirectly.


New rules allow you to 'carry forward' your unused Concessional Contribution Cap

At this time of year, we review all our clients super accounts and, for many, we assist with calculations for additional Concessional Contributions into Super (contributions for which the member can claim a personal tax deduction). The current cap is $25,000.

This year, for the first time, if you don’t use up your whole cap, most people can carry forward the remaining balance and put more in next year, or the year after. Your $25,000 cap will ‘carry forward’ for up to 5 years providing your total super balance is under a certain amount.

Here is the diagram from the ATO websitej, that shows the caps and examples of how contribution limits can be rolled forward:

Contribution Cap Carry Forward

The end result is that if you don’t have enough cash at the end of the year to make an additional contribution, you can still make the contribution next year without losing your 18/19 cap,

One of the key areas where this might benefit a client is if they plan to dispose of an investment property in the next 5 years and the capital gain will attract tax at a marginal tax rate higher than the individuals normal marginal tax rate. Saving up a couple of years of Contribution Caps and investing the sale proceeds within super may significantly reduce tax payable on the disposal and also boost tax effective super investment.

March Quarter Review

Economic Overview

It was quite the contrast between Q4 2018 and Q1 2019. While global shares posted sharp declines in late 2018 due to concerns over global trade, slowing economic growth and the US Federal Reserve’s signals on interest rate rises, these issues were either addressed to satisfaction, or no longer of great concern, as global shares went on a recovery rally during the first quarter of 2019.

In the US the Federal Reserve confirmed it would adjust planned interest rate hikes to compensate for deteriorating economic momentum, meanwhile the US government shutdown also ended. The Fed settled further into its dovish stance as the quarter progressed as several indicators reflected slower economic growth. Q4 GDP (quarter-on-quarter, annualised) was adjusted downwards to 2.2% from the initial 2.6% reading. There was also renewed hope of progress on the ever-present US-China trade tensions as the US suspended planned tariffs hikes on Chinese goods.

The Eurozone was also buoyed by the suggestion of a more dovish monetary policy. The European Central Bank said rates would remain at current levels at least until the end of the year. This was off the back of growth worries, as the Eurozone economy grew by just 0.2% in the final three months of 2018. Forward-looking data also pointed to weakness. The flash manufacturing purchasing managers’ index fell to 47.6 in March from February’s final reading of 49.3 (a reading below 50 indicates contraction).

In the UK, the labour market bucked a wider slowdown in the economy and real wages remained in positive territory as inflation was muted. The economy slowed during the fourth quarter of 2018 when Brexit uncertainty weighed on business investment. The Office for National Statistics revealed that GDP growth decelerated to 0.2% in Q4 from 0.7% in Q3 2018 and confirmed that economy grew at 1.4% in 2018, the lowest rate for several years.

Japanese economic data released in March was generally in line with expectations. Headline inflation was slightly ahead of forecasts with a broadening range of categories seeing some increase in prices. The Bank of Japan’s quarterly Tankan survey was also released just after the end of the quarter. Although conditions for large manufacturers have deteriorated, this was to be expected given the global backdrop at the time the survey was taken.

In Australia, the Reserve Bank again left the cash rate unchanged throughout the quarter as Annualised GDP growth slowed from nearly 4% in the first half of 2018 to around 1% in the second half. Meanwhile, housing continued to fall in many Australian cities, with Sydney prices now 13% from their 2017 peak.

Elsewhere, China’s economy grew at its weakest pace since 1990. January-February data pointed to a continued slowdown. The Chinese government lowered its full-year growth target to 6-6.5% and outlined higher public spending and tax cuts, while the central bank cut the reserve requirement ratios for banks.

Market Overview

Asset Class Returns

The following outlines the returns across the various asset classes to the 31st March 2019.

Returns March 19.jpg

The unpredictable nature of global markets was highlighted by a stunning bounce back in shares around the world in the first quarter, reversing a poor end to 2018.

US shares rebounded from a weak end to 2018 to post significant gains in Q1. Although sentiment cooled by quarter end, gains were widespread for the quarter overall. The IT sector – having suffered a difficult Q4 – performed especially well. Healthcare generated more muted gains due to uncertainty over potential regulatory changes. Gains in financials were also hindered by the Fed’s comments on rate trajectory.

Share Markets 2019.png

Eurozone shares enjoyed strong gains in the first quarter, rebounding from weakness at the end of 2018. Stock markets were supported by central banks stepping away from tighter monetary policy. It was a mixed picture for stock market sectors. Economically-sensitive areas of the market such as industrials and information technology performed well, but the safe haven consumer staples and real estate sectors were also among the top performers. The sharemarket in the UK also posted strong gains.

The Japanese sharemarket return of 7.7% was somewhat muted compared to other developed markets, and the gradual uptrend was punctuated by some significant individual daily declines. Most of the negative surprises were driven by the sharper-than-expected slowdown in the external environment, especially in China. This particularly affected results in the automotive sector while many tech stocks were also impacted by the slowdown in smartphone sales.

Emerging market shares posted a strong return in Q1, led by China. The MSCI Emerging Markets Index increased in value but underperformed the MSCI World. China A-shares were particularly strong as MSCI announced plans to quadruple their weight in the index between May and November.

The Australian market registered its best quarterly performance since coming out of the financial crisis.  According to Bloomberg data, it was the Australian market’s best first quarter in three decades of record keeping. The New Zealand market rose nearly 12% over the quarter, reaching record highs in late March.

Australia’s gains were led by materials stocks. Fortescue Metals was a standout, powered by iron ore prices hitting five–year highs. Strong gains were also posted in the sectors of IT, communication services, energy and real estate. Financials lagged the overall market, though, amid continued fallout from the Hayne Royal Commission.

Better Returns from Lower Grandfathered Commssions

What is Grandfathering?

In the context of Financial Planning in Australia, Grandfathering is most commonly a provision in which the old rules about commissions continue to apply to some existing clients while a new rule will apply to all future cases. As of 1st July 2013, commissions paid from investment products directly to advisers were banned. They were called ‘conflicted remuneration’. But if you had investments in place before 1st July 2013, the commissions may still be being paid from your investment to the adviser, even if you don’t even know who the adviser is and haven’t seen them for years.

So, if you have a super account, or an investment that has been in place since before 1 July 2013 it’s very likely that you are paying extra fees which would be against the law if you opened the account now. And obviously, these fees (called ‘trails’) are significantly eroding your returns each and every year.

As a result of the recent Royal Commission, the government is moving to ban these grandfathered commissions but not until 2021.

At Swift we receive zero trailing commissions on investment products and we have zero ‘grandfathered’ clients, and we never have at any time in the past. All of our income for managing investments is paid to us directly from our clients and only our clients. We have only one master, and it’s our client!

Get a Second Opinion on your financial strategy

If you would like to have a discussion about your financial plan, or a ‘second opinion’ on your current investments or strategy, please don’t hesitate to contact me. I would be only too pleased to have an obligation free chat with you.

2019 Federal Budget Review

So, we’ve had the budget. It’s great for journalists and TV news, but don’t make any big decisions just yet. Budget measures take some time to become law, and with a ‘hard-to-pick’ election coming up very soon it’s very difficult to say how much of the budget will ever actually become law.

A couple of the measures will become effective immediately or at least before June 30, but many elements are ‘campaign material’ only at this point. We will keep an eye on it and speak to our clients about how any changes may affect their strategies if and when the changes become likely or real.

For those that like a bit of reading, here are the main points of the budget as I see them:

Business Changes

The Instant Asset Tax Write-Off will increase to $30,000 and become available for medium sized businesses (those with an aggregated annual turnover of between $10 million and $50 million) as well as small businesses. The increased threshold and eligibility apply from the release of the budget at 7:30pm on 2 April 2019. The write-off will operate until 30 June 2020.

Income Tax

The Low- and Middle-Income Tax Offset (LMITO) will be increased. The base amount from $200 to $255 and the maximum amount from $530 to $1,080. Those with incomes between $48,000 and $90,000 will be eligible to receive the maximum offset of $1,080. The offset phases out at $126,000.

The changes are to apply for the current financial year, which means if Government can legislate these changes the offset will apply to tax returns lodged from 1 July 2019.

Tax Rate Changes: From 1 July 2024, a reduction in the 32.5 per cent tax rate to 30 per cent, abolishment of the 37 per cent tax rate and increase the threshold for the 30 per cent tax rate to $200,000. This tax bracket will apply to incomes between $45,001 and $200,000.

Superannuation

Flexibility for Older Australians voluntary superannuation contributions (both concessional and non-concessional) will be allowed to be made by those aged 65 and 66 without meeting the work test from 1 July 2020. People aged 65 and 66 will also be able to make up to three years of non-concessional contributions under the bring forward rule. Those up to and including age 74 will be able to receive spouse contributions, with those 65 and 66 no longer needing to meet the work test.

Tax Relief on Merging Funds current tax relief for merging superannuation funds that is due to expire on 1 July 2020 will become permanent. The current tax relief allows the transfer of revenue and capital losses to a new merged fund, and to defer taxation consequences on gains and losses from revenue and capital assets.

Aged Care

Home Care Packages will support elderly people who choose to receive care in their own homes,  $282.4 million will be provided over five years from 2018-19 for an additional 10,000 home care packages.

Commonwealth Home Support Program: $5.9 billion over two years from 2020-21, the CHSP contributes home support services, such as meals (Meals on Wheels), personal care, nursing, domestic assistance, home maintenance, and community transport, all to assist older people to live independently in their own home.

Elder Abuse: a national plan to Respond to the abuse of older Australians. $18 million to create a new National Hotline (1800 ELDERHelp or 1800 353 374) and conduct trials of frontline services for victims of abuse. The Government is also contributing $1.5 million towards developing a Serious Incident Response Scheme.

Energy Assistance

An Energy Assistance Payment of $75 for singles and $62.50 for each member of an eligible couple ($125/couple) who receive a qualifying payment on 2 April 2019 to provide relief from high energy costs. Payments to benefit: Age Pension, Carer Payment, Disability Support Pension, Parenting Payment Single, and Veterans’ pensions and payments.

Get your kids off to a good start with Superannuation

Small Superannuation Accounts.jpg

Small super accounts have received a bit more protection as of 12th March, with new legislation receiving assent.

Super fund trustees are now prohibited from charging fees totalling more than 3% of a super account with a balance of less than $6,000,

Inactive superannuation accounts will also have to be transferred to the ATO where the owners are more likely to find them before fees and default insurance eat them up.

I often meet young people who’s first experience of the super system is a bad one, where their hard-earned super balance is eroded or completely gobbled up by fees when the account only has a few hundred dollars in it from holiday work. Some of these changes will go a long way helping this situation.

If you would like some advice on where to start off your super, or your child’s super with zero fees please feel free to contact us. No tricks I promise!

Increase to the Work Bonus Scheme means more income for retirees

Work Bonus is part of your financial strategy.jpg

The Commonwealth Government Work Bonus Scheme allows people on the Age Pension to earn an amount of $250 per fortnight that does not count towards their Income Test, and hence does not affect or reduce their Age Pension payment.

It’s a great idea aimed at keeping ‘oldies’ motivated and active. It’s well known that a little bit of enjoyable, meaningful work, especially with other people you like, is very healthy for you at any stage in life, but particularly as you get older. It also helps stretch out the super balance and, in the end, achieves the double benefit of more money for the individual and less cost to the government.

All of the above reasons make part-time work in retirement an important part of our financial strategies for clients over the age of 65. The effects on your financial future and well-being are enormous.

I also advise small businesses to look for older people wanting part time work to fill spots where they need experience, reliability and skills. I never cease to be amazed at the quality of people we get applying for part time positions. It seems very common for top quality people to get to the stage where they work because they want to, rather than have to, and have a great deal to offer. And all with a great attitude. Last year we had a full time position that we just couldn’t fill. In the end we tried advertising it as part time and took two applicants. One did 2 days and the other did 3 days and together they are amazing.

However, the latest government figures tell us that only about 150,000 pensioners are using the Work Bonus Scheme. That’s only about 6% of Age Pension recipients.

Maybe the numbers will increase a little bit come July 1st this year, as the threshold is being increased to $300 per fortnight. That’s $7,800 per year, in most cases, tax free and ‘Pension Reduction’ free.

Another change is that you will now be able to claim the Work Bonus if you are self-employed. It used to be that the income had to come from employment but now sole traders and self-employed business owners can claim it also.

And if you think it’s a good idea but the thought of a visit to Centrelink is too much for you, don’t worry, it’s applied automatically to your income. You will only need to tell Centrelink you’re working and they will do the rest.

Review of 2018

Economic Summary

Global equities posted sharp declines in the December quarter, delivering their worst yearly performance in seven years largely on the back of the final three months. The major concerns were global trade, slowing economic growth and the US Federal Reserve’s plans for further interest rate rises. Government bond yields generally fell (prices rose), reflecting the broad uncertainty.

In the US, the US-China trade dispute also continued to hamper investor optimism. The Federal Reserve (Fed) raised interest rates in December on continued stability in economic data. The labour market remained extremely strong. However, the central bank grew otherwise more dovish in tone, signalling a more cautious view for coming months.

GDP growth forecasts were revised down for 2019, with inflation projections also adjusted downwards. Warnings from several notable firms – most significantly from Apple – also fanned fears that earnings growth may slow.

2018-Equities.jpg

In the Eurozone, data pointed to slowing momentum in the EU economy. The flash composite purchasing managers’ index for December showed business activity slowed to the weakest level in over four years. The index came in at 51.3, down from 52.7 in November.

The “gilets jaunes” protests in France and weak demand for new cars were factors weighing on activity. As expected, the European Central Bank confirmed the end of its bond-buying program in December and reiterated that interest rates would remain on hold “at least through the summer of 2019”.

In the UK, despite the uncertainty, and the risk of a recession in the event of a “no deal” Brexit, the economy continued to recover from the very poor start to 2018. UK Q3 GDP growth came in at 0.6% quarter-on-quarter as expected, up from 0.4% in Q2 and the fastest pace since Q4 2016.

More recent data, however, has been volatile: UK retail sales disappointed in October, falling -0.5% month-on-month, but bounced back very sharply in November, increasing by 1.4% month-on-month, which was significantly above consensus expectations. UK households enjoyed an acceleration in wage growth and lower inflation over the period.

In Japan, little changed during the quarter. The Bank of Japan’s regular policy committee meetings resulted in no change to monetary policy, as expected. Economic news was somewhat mixed, but all the data needs to be viewed in the context of a succession of natural disasters in Japan which caused some slowdown in activity followed by a relatively strong rebound in subsequent months.

In December, the Reserve Bank of Australia (RBA) once again held the official cash rate at 1.5%, extending Australia’s longest ever stretch without a rate move to 28 months. RBA Governor Philip Lowe noted that global economic expansion was continuing, but there were ‘some signs of a slowdown in global trade, partly stemming from ongoing trade tensions.’

Even with continued low rates, there was no sign of an end to the property price falls in some mainland capitals, with Sydney recording the biggest annual decline since May 1983, according to CoreLogic.

Persistent concerns over the US-China trade conflict and the pace of US interest rate hikes dominated sentiment across Asia ex Japan. The darkening global economic outlook further troubled investors. Notably, China’s economy recorded its weakest quarterly growth since the global financial crisis. Industrial production and retail sales also slowed more than expected, heightening growth concerns.

Market Summary

Asset Class Returns

The following outlines the returns across the various asset classes to the 31st December 2018.

Dec2018Returns.jpg

The December quarter did the majority of the damage in 2018, though over the full year returns were still positive in the majority of asset classes. Most balanced and diversified portfolios would have held their ground over the course of the year.

In the US equities declined materially in Q4 – with especially steep falls in December – due to fears over economic momentum and slower earnings growth. The US-China trade dispute also continued to hamper investor optimism. The large cap S&P 500 index outperformed the small & mid cap Russell 2500 index (-16.7%), but still declined by -13.5%.

Europe and the UK weren’t spared the December quarter damage, with both markets recording double digit falls over the period. It was the same story, worries over rising US interest rates, trade tariffs, slower Chinese growth and Brexit combined to form a difficult environment for risk assets like shares. The defensive sectors of communication services and utilities – often perceived as safe havens due to their stable earnings throughout the cycle – were the only sectors to register a positive return.

For the Australian market, the 3% fall for the year was its first decline since 2011, with again most of the damage done in the December quarter. In sector terms, financials, communication services and energy stocks were among the worst performers for the year in Australia and globally, while gains were made in healthcare, IT and real estate investment trusts (REITs).

Finally, emerging markets ended down around 5% for the year—although this followed a robust 27% gain in 2017

Can you learn anything from 2018

While 2018 was a rougher year for equity markets than we have seen in recent years, with volatility periods at the start and end of the year, a longer-term perspective shows the virtues of a patient approach. The chart below shows the growth of wealth from a dollar invested in a 50% growth, 50% defensive portfolio over the past 20 years. The past year is highlighted towards the end of the line.

Growthto2018.png

While market volatility can create anxiety for some investors, the record shows that reacting emotionally and changing long-term investment strategies in response to immediate news and short-term declines can prove more harmful than helpful and to highlight this, 2019 has resumed with something of a market recovery.

As we’re in a new year, the media’s focus has turned to speculating about possible developments for the year ahead. Recently, we have seen many opinions about the possible outcome of trade tensions, Brexit, interest rate cycles, geopolitics and commodity prices.

While it is natural to have an opinion on any of these issues, it is worth remembering that all these views and expectations from market participants are already built into prices. The news that moves prices changes every day. And even if you could forecast events, you still need to anticipate how the market will react.

You might have more luck with tonight’s lotto numbers.

2018 September Quarter Review

Economic Overview

Economic growth and earnings data remained robust during Q3, and this ultimately overshadowed simmering concerns around the escalating US-China trade war. The US initially targeted $34 billion of Chinese products with a 25% tariff in early July, while monetary policy tightened in the US. Markets were mostly positive in developed countries, but there was significant volatility in some emerging markets. Commodities struggled against a strengthening US dollar, while energy continued to rise with the prospect of sanctions on Iran.

In the US, ongoing growth and strong employment figures allowed the Federal Reserve to increase the federal funds rate by 25 basis points. The committee also dropped its long-standing description of monetary policy as “accommodative”, reaffirming an outlook for ongoing hikes in 2019. Data released in September showed wages to be growing at the fastest rate since 2009, while industrial activity indicators show little impact from the trade wars.

Investmennt Climate Global Equities.jpg

In the EU, fears over trade impact on Europe were calmed following a meeting in July between US President Trump and EU President Juncker. From this came an agreement to work towards zero tariffs on non-auto industrial goods, while new car tariffs were put on hold. Growth for the second quarter was revised up to 0.4% quarter-on-quarter, compared to the initial estimate of 0.3%.

In the UK fears for the economy were reflected in the value of the pound, which resumed its downward trajectory over the period. However, the outlook for the domestic economy improved, as growth recovered from the slow first quarter, prompting the Bank of England (BoE) to increase interest rates by 25 basis points.

In Asia, Japanese company profits continued to improve. Economic growth rebounded strongly from the short-term weakness seen in Q1 and corporate sentiment remained relatively firm given the tightness in the labour market and the uncertain global outlook. Meanwhile, Chinese macroeconomic data disappointed as they retaliated against US trade tariffs. Authorities announced a range of targeted economic support measures, including fiscal stimulus and credit easing. The central bank also re-introduced macro prudential measures to stabilise the renminbi.

In Australia, it was much the same as Q2, as the Reserve Bank continued to hold the cash rate, while house prices continued to fall as tighten lending conditions influenced mortgage lending and real estate, particularly in Sydney.

Market Overview

Asset Class Returns

The following outlines the returns across the various asset classes to the 30th September 2018.

Asset Class Returns.jpg

Global equities gained in Q3, primarily due to US market strength. Political uncertainty and trade concerns weighed in other regions. US equities significantly outperformed other major markets. Economic growth and earnings data remained extremely robust, ultimately overshadowing concerns surrounding the escalating US-China trade war. The US equity bull market became the longest in history on August 22.

Eurozone equity gains were modest with the MSCI EMU index returning 0.4%. Energy and industrials were the leaders. Financials made a good contribution despite weakness in the banking sector amid concerns over exposure to emerging markets as well as worries over the Italian budget.

The UK’s FTSE All-Share fell 0.8% over the period. The Bank of England increased base rates and sterling fell in response to political noise around Brexit. Any slowdown in global growth and trade tends to have an outsized impact on emerging markets and emerging market exposed areas of the UK stock market, including financials and miners, performed poorly as a consequence.

Although trade tensions continued to escalate during the quarter, the Japanese stock market ended September above its recent range to show a total return of 5.9% for the quarter.

Emerging markets equities lost value in what was a volatile third quarter, with US dollar strength and the US-China trade dispute weighing on risk appetite. The MSCI Emerging Markets index decreased in value and underperformed the MSCI World.  By contrast, Thailand recorded a strong gain and was the best performing index, with energy stocks among the strongest names. Mexico outperformed as the market rallied following general elections and an agreement with the US on NAFTA renegotiation.

Investment Climate Australian Sectors.jpg

Australia’s performance was relatively good across the quarter given the attention focused on some of the ASX’s largest companies. The banking royal commission has been felt acutely by shareholders of Australia’s big four banks throughout 2018, though there was a mild recovery between the end of Q2 and the beginning of Q3.

2018 June Quarter Review

Economic Overview

Global economic data proved resilient during Q2 though it was offset by renewed geopolitical tensions. Equity markets were volatile, but mostly positive, while the potential for a trade war between the US and China turned into a reality, while the Trump administration withdrawing from the Iran nuclear accord contributed to higher energy prices.

In the US, consumer confidence remained strong with retail sales data suggesting a consumption rebound after a softer Q1. The unemployment rate also reached an 18-year low of 3.8%, accompanied by robust wage growth. The Federal Reserve raised the target rate for Fed Funds by 0.25% and marginally increased its 2018 forecasts for growth and inflation.

The positive US economic data was balanced by moves from the Trump administration to impose tariffs on Chinese imports and withdraw from the Iran nuclear accord. In combination, these steps amounted to a more combative trade posture from the US, driving oil prices higher, and weighing on longer-term growth expectations.

EquitiesJun18.jpg


In the eurozone the quarter was marked by the return of political risk. Markets feared Italy may need fresh elections following an inconclusive outcome in March, with concerns this would become a referendum on Italy’s membership of the euro. However, a governing coalition was eventually formed between populist parties. Spain also saw a change of government, although this was largely greeted with calm, while German Chancellor Angela Merkel clashed with sister party the CSU over immigration.

Economic data from the eurozone pointed to steady growth but at a slower pace than last year. GDP growth for the first quarter was down to 0.4%. The European Central Bank (ECB) announced that it expects to end its quantitative easing programme in December 2018. The ECB added that interest rates will remain at current levels through the summer of 2019.

In the UK the Sterling performed poorly after the Bank of England backed away from a much-anticipated rate rise (in contrast to an increasingly hawkish US Fed). This followed with a flow of disappointing macroeconomic data, which culminated in the Bank reducing its 2018 growth forecasts – it is now expecting the UK economy to expand by 1.4% this year, versus 1.8% previously.

In Japan, economic indicators pointed towards a recovery from the GDP decline seen in the first quarter. Data released at the end of June provided some positive surprises with industrial production and inflation data for Tokyo both ahead of expectations. The strength of the labour market is nothing new, but a decline in Japanese unemployment to 2.2% was viewed as positive for inflationary expectations.

Asia ex Japan saw positive developments with regards to peace on the Korean peninsula. An Inter-Korea Summit saw leaders from the South and North pledge to agree a formal end to the war between the two sides. US President Trump subsequently met with North Korean leader Kim Jong-un in Singapore in June. In China, the central bank cut the reserve ratio requirement for banks by a total of 1.25% over the quarter to encourage lending and support growth

In Australia, the Reserve Bank continued to hold the cash rate at 1.5% as macroprudential policy and the spectre of the banking Royal Commission continued to influence mortgage lending and real estate market.

The Bloomberg Commodities index posted a slightly positive return in Q2. Crude oil prices continued to rally, with President Trump’s decision to withdraw the US from the Iran nuclear accord, despite OPEC announcing plans to boost supply. The industrial metals index registered a small gain. Nickel (+11.9%) and aluminium (+8.4%) were firmly up while zinc (-11.5%) and iron ore (-1.7%) lost value.

Market Overview

Asset Class Returns

The following outlines the returns across the various asset classes to 30th June 2018.

June18Returns.jpg


Global equities made gains in a volatile quarter, as resilient economic and earnings data vied with an unsettling geopolitical backdrop to establish the market’s direction. Bond markets struggled despite risk aversion escalating late in the quarter.

US equities advanced in Q2, with positive earnings momentum and supportive economic data ultimately overcoming US-China trade concerns Over the quarter, energy, consumer discretionary and technology stocks performed well, while a rotation into more traditionally defensive areas supported real estate and utilities.

Eurozone equities posted positive returns in the second quarter. Top performing sectors included energy, information technology and healthcare. Financials were the main laggards, posting a negative return; Italian banks struggled amid political uncertainty. Auto stocks fell with intensifying trade concerns as US President Trump threatened tariffs on imported vehicles.

UK equities bounced back as international investors reduced their underweight in the country, albeit sentiment towards the UK remains extremely negative. Prior to the period under review, the UK’s unpopularity with international investors had hit levels not seen since the global financial crisis.

While Japan eeked out a 1.1% gain for the quarter the rest of Asia was firmly down in Q2 with global trade concerns serving to increase risk aversion. The MSCI Asia ex Japan Index generated a negative return and underperformed the MSCI World.

OzSectorsJune18.jpg


Emerging market equities recorded a sharp fall in Q2 with US dollar strength a significant headwind. Escalation in global trade tensions also contributed to risk aversion as US-China trade talks failed to deliver a sustainable agreement. Meanwhile the US moved to extend steel and aluminium tariffs to the EU, Canada and Mexico, resulting in the announcement of retaliatory measures. The MSCI Emerging Markets Index recorded a negative return and underperformed the MSCI World.

Australia was one of the best performing developed markets, despite weakness in heavyweight financial stocks and Telstra. Energy was one of the standout sectors locally and globally, supported by healthcare, consumer staples and IT. In developed markets, listed property was also a notable positive performer.

The Banking Royal Commission

The other day a friend asked me what I thought about the Banking Royal Commission. I replied that I was not surprised by most of what I had heard about the banks and the financial planners. I then gave my normal little speech on vertically integrated business models and the 'hopeless conflicts' that they create for the people working in those organisations. I then realised that my world is actually very far removed from 'bank-world' and my job as a financial planner is very different than it would be in a large institution.

When you operate your own financial planning business you need to be licensed. Some small firms apply for their own licences, but most find it more cost effective to become an 'Authorised Representative' of an Australian Financial Services Licence holder. There is lots of choice out there. The banks and AMP all offer licencing under different names for smaller advice firms. It's part of the vertically integrated business model mentioned above. There are also lots of privately owned licensees that you can choose from.

Financial Planning in Bathurst

When I started my financial planning business in Bathurst, I searched for about 9 months to find the right licensee for me. I spoke to a number of advisers about their licensee. These included bank licensed and also privately licensed firms. I was searching for a licensee that believed in my kind of investing, was driven by having great relationships with clients, and could provide support to make my business efficient.

I found a licensee called FYG Planners.

FYG Planners is privately owned and has no connection to any bank or institution. FYG Planners has no inhouse products so there is no bias towards any financial product. The goal of FYG Planners is for the advisers under their AFSL to build their financial planning business with their client being the first priority. 

FYG Planners encourages only the best financial practices and it’s somewhat of a ‘John West’ in the financial planning industry. Every year many financial advice businesses look to change their licensee. Hundreds approach FYG Planners for licensing. Upon scrutiny, FYG rejects around 99% of the financial advice businesses they’re approached by each year.

It’s a select licensee based on ethics, trust, investment philosophy, skill and, of course, a little bit of personality.

The 42 firms under the FYG license meet twice a year to continually update skills and keep abreast of best practices to better serve clients. This isn’t just limited to conferences, FYG has a massive knowledge base available and all firms are committed to supporting their fellow advisers. The overriding goal is providing clients with objective advice and personal solutions, which incorporates a structured and proven approach to investing and a fiduciary-based financial planning and wealth management service.

Finally, FYG management have been proactive in raising the bar for financial advice in Australia and around the world. FYG directors Peter Mancell and Jason Fowler are founding members of the Global Association of Independent Advisers (GAIA), a group of 17 advisory firms based in Australia, NZ , US, UK,  Germany, Sweden , Switzerland and Chile, who collectively have an overriding commitment to fiduciary excellence.

The group openly shares global best practices and those ideas flow back into FYG Planners, so advisers can learn from each other and better serve clients.

Fixed Fees

So if you choose to come to me for financial planning advice, you can be assured that I am working for you and only you. I am not a salesman for any financial product. In most (but not all) cases I charge fixed annual fees. This means that I get no more from you investing in the share portfolio that I may believe in or whether you invest in your auntie's kiwi fruit farm - I get paid the same. So if, after review, I believe the kiwi fruit is the best investment for you at the time, that is what I will recommend and facilitate (this kiwi fruit farm investment advice is general in nature and does not take into account your personal circumstances or fruit preferences - you should seek professional financial planning advice before investing in any kiwi fruit farms).

No-one is ever going to ask me how much 'Funds Under Management' I have added this month, how many insurance policies I have written or how many fees I have charged. You can be assured there are no 'hopeless conflicts' in the structure of the business.

It is rarely the individuals at the banks that are the problem. It is the business model. Any good employee in a team does their bit for the team. But as good hearted as the individual planner is, I believe that until he or she takes the step to leave the bank, or any other financial planning company that operates the same business model, they will always be in the middle of a conflict between the expectations of the shareholders to generate profits and the needs of the client.


Budget Review

Last night’s federal budget stood out on a tax perspective and there were a couple of other positives to be found. Importantly, we’ve just clocked two consecutive budgets without major superannuation meddling. And the super changes we did get were positive.

Pensioners

The Pension Loans Scheme will be opened to all Australians over 65, including full rate pensioners and self-funded retirees, so they can boost their retirement income by up to $11,799 for a single and $17,800 for a couple without impacting on their eligibility for the pension or other benefits. Essentially a reverse mortgage, anyone over the retirement age can now access equity in their homes without selling.

Repayments of the loan generally occur from the sale proceeds once the house is sold however it can be repaid at any time. Ironically, last year the government was offering downsizing incentives to home owners over the age of 65.

An expanded Pension Work Bonus will be implemented to allow pensioners to earn an extra $1,300 a year without reducing their pension payments, whereas the bonus will be extended to self-employed individuals who can now earn up to $7,800 per year.

The Government will increase the number of home care places for elderly Australians by 14,000 over 4 years at a cost of $1.6 billion, whereas $146 million will be provided to improve access to aged care services in rural, regional and remote Australia.

Superannuation

From July 1, 2019, exit fees on all super accounts will be banned and there will be a 3 per cent annual cap on passive fees on super accounts with balances below $6000. All inactive super accounts with balances less than $6,000 will be transferred to the Australian Taxation Office, which will then “proactively” reunite these inactive accounts with their owners. 

From July 1, 2019, insurance within super will move from an opt-out to an opt-in model for members with balances of less than $6000, members under the age of 25 and members who have not received a contribution in the past 13 months.

For young people this is important, as we all know the most powerful gains will be made by the earliest dollars saved, so any dollar saved and compounded will provide a significant benefit down the line. Obviously, there will have to be some consideration given as to when it is appropriate to opt back in to insurance coverage.

From 1 July 2019, members aged between 65 and 74 who have super balances below $300,000 will be able to make voluntary contributions in the first year that they do not meet the work test requirements.

Self-managed super funds (SMSFs) will be able to increase the number of members from a maximum of four to a maximum of six. The increased membership will apply from 1 July2019. Some SMSFs will need to ensure that their trust deeds are updated to lift the restriction on the number of members from four.

Property

Government will deny deductions for expenses associated with holding vacant land. This is an integrity measure to address concerns that deductions are being improperly claimed for expenses (such as interest costs) related to holding vacant land, where the land is not genuinely held for the purpose of earning assessable income. The restriction won’t apply to any expenses incurred after construction begins on the vacant block or any land being used by owners to carry out business, such as farmers’ crops.

Developers will also be prevented from selling more than 50% of new developments to foreign investors.

Business

The Government extended the $20,000 instant asset write-off for another 12 months to June 30, 2019, something they also did at last year’s budget. The initiative was initially introduced in the 2015-16 budget.

Medicare

The government will also keep the Medicare levy at 2 per cent, instead of increasing it to 2.5 per cent from July 1, 2019 as was previously planned.

Tax

The Government wants to deliver tax relief to lower and middle-income Australians, which it says will benefit more than 10 million people. The most immediate measure will be changing the low-income tax offset (LITO). From next July, those who earn up to $37,000 will see their tax bill reduce by $200. This benefit will be enjoyed at tax return time with a refund.

The tax offset increases incrementally for those earning between $37,000 and $48,000, before the maximum offset of $530 is applied to those earning between $48,000 and $90,000. The benefit then marginally decreases to zero when taxable income reaches about $125,000.

Bracket creep will also be addressed in stages.

From July next year, people earning between $87,000 and $90,000 will move back into the lower tax bracket and pay 32.5 per cent instead of 37 per cent in tax. In 2022, the top threshold of the lower tax bracket will be increased from $37,000 to $41,000, meaning more earners will fall inside the 19 per cent tax rate bracket.

Treasurer Scott Morrison says the plan will eventually mean 94 per cent of Australian taxpayers will pay no more than 32.5 cents in the dollar.

Tax dodgers

A new $10,000 limit for cash payments for goods and services from July 1, 2019. The government also aims to raise $3 billion over the next four years by funding new mobile strike teams, increasing audit presence to crack down on tax avoidance and money laundering.

University HELP/HECS

Young people from regional, rural and remote communities enrolling in university courses will find it easier to get access to Youth Allowance payments while they are studying away from home. Eligibility for these payments is based on parental income. The threshold and assessment period for that eligibility test will change so that students whose parents earn up to $160,000 will now be eligible for support.

That threshold increased by $10,000 for each child in the family unit, and will now be calculated for the financial year before the student begins independent study (that is, studying while living away from the family home).

Budget deficit to disappear…

The government has forecast that the Budget deficit will be $18.2 billion in 2017-18, falling to $14.5 billion in 2018-19, with the deficit then falling to $2.2 billion in 2019-20, before turning to a surplus of $11.0 billion in 2020-21 and $16.6 billion in 2021-22.

We’ve been hearing the one about forecast surpluses from governments of all stripes for years. We have no comment on this one beyond our longstanding commitment not to pay any attention to forecasts.

Finally, smokers will get hit again. The government announced a crackdown on tobacco smuggling, meaning tobacco importers will be paying excise at the point of importation. Expect that to be passed on in the price. Does anyone still smoke?

As always, these measures need to be passed through parliament before we see them put into action.

This represents general information only. Before making any financial or investment decisions, we recommend you consult a financial planner to take into account your personal investment objectives, financial situation and individual needs.

2018 March Quarter Review

Economic Overview

Global economic data remained encouraging during Q1, though after a long period of relative calm and upward movement volatility again reared its head in equity markets. While towards the end of the quarter the potential for trade wars heated up.

In the US, economic data continued to be supportive. US business confidence reached a multi-decade high in March. GDP for Q4 2017 was revised upwards to show growth of 2.9%, and while industrial activity slowed – as measured by the ISM manufacturing index – it continued to indicate expansion.

The US Federal Reserve raised rates by 25 basis points in March, from 1.5% to 1.75%. It did not, however, alter its overall rate projection of three hikes for 2018. This announcement quelled some concerns, but escalating US-China trade sanctions precipitated a renewed bout of turbulence in March.

GlobalEquitiesmar18.jpg


In the eurozone, GDP growth for Q4 2017 was confirmed at 0.6% quarter-on-quarter and unemployment stable at 8.6% in January 2018. However, forward-looking surveys painted a picture of slower growth. The composite purchasing managers’ index (PMI) hit a 14-month low in March and annual inflation was 1.1% in February, below the European Central Bank’s (ECB) target. ECB chairman Mario Draghi noted interest rates would not rise until the end of the quantitative easing program.

While UK economic growth remained sluggish, in its February inflation report the Bank of England nudged up its growth forecast for 2018, from 1.7% to 1.8%. There was further progress with Brexit negotiations, with an initial agreement struck on the terms of a transition period for after the UK formally exits the EU.

The Japanese economy experienced a soft patch in Q1 2018 with many indicators of production and consumption slightly slipping. The most pervasive influence came from the switch in US policy towards increased protectionism. Investors were also taken by surprise by a sudden change in stance of players engaged in discussions on North Korea’s nuclear ambitions.

In Australia, the Reserve Bank left its own benchmark cash rate unchanged for a record equalling 18th consecutive meeting at 1.5%, pointing to strengthening economic growth alongside continued low inflation.

The Bloomberg Commodities index turned negative in Q1. Weakness came from industrial metals amid global trade tensions. While copper was particularly weak, down 8.3%, energy again recorded solid gains. Brent crude continued to rally amid confidence OPEC would maintain production cuts throughout 2018.

Market Overview

Asset Class Returns

The following outlines the returns across the various asset classes to the 31th March 2018.

ReturnsMar18.jpg


It was a mixed first quarter for global equity markets in 2018, with an upsurge in volatility from the very low levels of 2017 a major talking point.

US equities began 2018 strongly, buoyed by ongoing strength in economic data, robust earnings and the confirmation of a major tax reform package. However, the latter part of the quarter saw a marked increase in volatility. Investors first digested the destabilising potential of an elevated US inflation reading and the possibility that the Federal Reserve (Fed) may need to become more proactive in raising interest rates in order to keep upward price pressures under control.

SectorsMar2018.jpg


Eurozone equities delivered negative returns in the first quarter, with the bulk of the declines coming in March. Markets began the year on a firmer footing but worries about the path of US interest rates and the outlook for global trade led to declines for the period overall. Sentiment towards UK equities was poor as the FTSE All-Share fell 6.9%. Overseas buyers shunned the market amid ongoing political uncertainty and a weak outlook for economic growth.

After a strong start to the year, Japanese equities followed a similar pattern to other global markets and ended the quarter 4.7% lower. The heightened uncertainty resulted in a stronger yen against major currencies. Corporate results to December 2017 showed very positive trends.

Emerging markets equities registered a positive return in the first quarter, despite a rise in market volatility stemming from tensions over global trade. The MSCI Emerging Markets Index recorded a positive return and outperformed the MSCI World and although Chinese equities were volatile towards the end of the quarter, given rising trade tensions with the US, the market recorded a positive return and outperformed.

Australia was dragged down by its heavyweight banking sector as the potential impact of the Banking Royal Commission began to weigh. In sectoral terms, the other big losers on the Australian market were telecommunications stocks, utilities, REITs and energy.

The China Hustle

If there’s one constant about money, it’s that someone is always wanting to take it from you. As disheartening as that statement is, the quicker investors learn it, and understand who they can and can’t trust, the more secure their financial prospects will become.

Bringing us to the latest financial fraud documentary, The China Hustle.

In the aftermath of the 2008 financial crisis a lot of investors in the US were looking to quickly recoup their losses. At the same time, many Chinese companies were looking to trade on US stock markets, but couldn’t do so directly. Some lower tier US investment banks got involved to help facilitate Chinese companies to list in the US through a backdoor using dormant companies that still had a stock market listing.

Hundreds of Chinese companies found their way onto US markets this way and some big money was being made as share prices surged. Until one US businessman, working in China, decided to investigate a Chinese paper company on behalf of his father who wanted to invest in it.

Orient Paper claimed to be doing $100 million in annual revenue. When the businessman arrived at their factory, he found a run-down operation completely incapable of doing the kind of revenues suggested, nor supporting the company’s market valuation.

It was a complete fraud and many of these Chinese backdoor listings were complete frauds.

And in a story as old as time, the only protection investors had, was the belief in their head that regulators exist to protect them – so no protection at all. The investment banks doing the backdoor listings were also putting buy recommendations on the companies and the unsophisticated individual investor, seduced by potentially high returns, were left holding the bag when the frauds were uncovered.

As one interviewee said, “you’re buying lottery tickets”. And when it comes to individual stocks, Chinese or not, that’s often the case.

In Australia 26 Chinese based companies currently trade on the ASX, only 5 are currently trading above their initial listing price. The ASX has rejected another 21 Chinese companies from listing on the ASX over the past two years.

This material is provided for information only. No account has been taken of the objectives, financial situation or needs of any particular person or entity. Accordingly, to the extent that this material may constitute general financial product advice, investors should, before acting on the advice, consider the appropriateness of the advice, having regard to the investor’s objectives, financial situation and needs. This is not an offer or recommendation to buy or sell securities or other financial products, nor a solicitation for deposits or other business, whether directly or indirectly.

What's all this talk about Franking Credits?

Labor’s proposed change to franking credit refunds on dividends has provoked quite a debate in a short space of time.

For a quick primer, under the imputation system, companies who pay franked dividends to shareholders can pass on a tax credit for company tax already paid. When shareholders receive the franking credits, they can be used to offset other income tax liabilities.

When shareholders have low or no taxable income, such as those drawing a super pension, franking credits may be paid out as cash refunds. This doesn’t matter whether your pension income is $18,000 or $180,000.

Where people stand on it will likely be determined by any benefit derived from it. Investors need to be aware while much of the focus has been on individual shares, this will also have an affect on pension returns if they’re holding funds that have franking credits paid to them. In that respect, we would have many affected clients and given we work for our clients, it’s a change we’re not in favour of.

With that in mind, some of those being profiled as affected by the change haven’t exactly helped their cause. There’s a strange phenomenon in the Australian media where the moment someone is about to feel the pain of a government change they immediately claim ‘battler’ status.

Whether by accident or by design, the media has mostly focused itself on tales of woe from retirees living in affluent NSW suburbs who have decent levels of wealth and income. One retiree claimed to be ‘just scraping by’ on $86,000 per annum while admitting he kept a holiday property for his children to use.

These profiles are hardly likely to win the hearts and minds of younger voters who are the target of Labor’s argument that only the well-off will be affected. Unfortunately, there are plenty on significantly lower incomes, with fewer assets, who gain a nice bump from their cashbacks and will feel a lot more pain.

Not that the regular reshuffling of the rules around retirement hasn’t been a bipartisan act. As we all remember, the Liberals and the Greens joined together to tighten up pension eligibility only last year.

There have been the usual groans (like with the pension changes) of “why did we bother saving and investing” from some quarters. While the frustration is understandable, no matter the government fiddling, wealth will always provide options in life. Wealth will fund a better lifestyle than one without. And there’s no question, wealth will mean someone will be better able to take care of themselves in retirement than someone without wealth. So keep saving and keep investing, it's the best defence against having the goal posts moved.

"Stock Markets Crash" - Let's get some clicks on our website....

Well, it’s happened, or it’s happening. The correction that we’ve been told has been coming every month since January 2017, arrived. It's been great for getting clicks on websites and selling a few newspapers (do they still print those). Billions 'WIPED OFF' the market! The billions that have been wiped off so far were only WIPED ON since November last year.

Is it over? Probably not, but so far it's quite normal and unexciting.

Normal?

Yes normal. 2017 was an extremely rare year where the entrants to world equity markets enjoyed a free pass to the park and none of the rides had any bumps, jumps or scares. The biggest decline happened early in 2017 and then equity markets happily chugged upwards

How should you deal with this correction? Well it depends on your investment time-frame and your personal objectives, but for most people, you should ignore it.

Like all downward movements there are the regular tea leaf readings, inferences about past crash behaviour being an indicator of the future along with the unveiling of scary stats and charts reminding us of uncharted territory. I particularly like it when those holding gold start screaming that the end of the capitalist world is coming.

In other words, we’re expected to believe it’s eerily similar to 1987, 2008 and the great depression, but it has the possibility to be much worse!

Last Friday’s fall on the Dow Jones was 666 points. Tuesday’s fall was 1175 points. Ouch! To put that fall in some sort of perspective, the Dow Jones wasn’t even worth 1175 points until April 1983. 35 years later the whole weight of that index is a 4.6% daily loss.

Could a correction become a bear market or a crash? Always possible. However, time has shown almost no corrections go further to become crashes. Given enough time, most turn into buying opportunities.

It’s usually a recession that sets off serious bad times in equities. So why are sharemarkets falling when we have the opposite economic conditions in the world’s biggest economy? It’s because investors are reacting to what that growing economy means – inflation and interest rate increases.

Rates fell to historic lows in the financial crisis and have only recently started to rebound. Low rates make investors turn away from fixed interest and cash to embrace shares. With the ‘risk free rate’ rising, shares get re-priced such that the ‘equity premium’ (the extra you get for taking on the risk of shares instead of fixed interest and term deposits) is maintained.

At the same time, an expanding economy means companies will expect greater long-term growth and will expect corporate profits to remain robust.

As usual, if the rough times aren’t over, don’t sell the good stuff that have served you well in hopes of avoiding market carnage. If you are inclined to, remember there is no way you’ll know when to buy again. Despite a correction often being the best time to buy, many investors don’t have the fortitude to don their floaties and enter the choppy water to grab a bargain.

Last year’s stability was an anomaly. Now it’s back to normal programming.


This represents general information only. Before making any financial or investment decisions, we recommend you consult a financial planner to take into account your personal investment objectives, financial situation and individual needs.

2017 Economic Review

In 2017, once again, the investment strategy of maintaining discipline and holding for the long term won out over reacting to media forecasts and predictions from speculators. In January 2017 CNBC suggested Wall Street was the most bearish they’d been in 12 years, as it turned out, the global economy continued to strengthen as share markets posted solid returns on low volatility.

In the fourth quarter, defeats in US Senate contests struck fear into Republicans about 2018 mid-term elections and they quickly agreed to the long talked about Trump tax reform bill. Markets rallied with big tax cuts ahead for corporations. US employment data remained strong, but was distorted by the effects of hurricane season.

As was widely anticipated, the US Federal Reserve lifted interest rates by 25 basis points in December. The Fed also raised its growth forecasts for 2018 to 2.5% from 2.1%.

2017 Equities.jpg

In the Eurozone, data showed the economy continuing to recover. The unemployment rate fell to 8.8% in October, the lowest rate since January 2009. In October, the European Central Bank announced that quantitative easing would be extended to September 2018 but that the pace of purchases would be reduced from the €60 billion per month currently down to €30 billion.

Despite a sluggish economy, the Bank of England’s monetary policy committee raised interest rates for the first time since November 2007, from a record low of 0.25% back to 0.50%. Annual consumer price index inflation reached 3.1% in November, breaching the BoE’s upper target.

The Bank of Japan’s quarterly Tankan survey recorded the strongest sentiment among large manufacturing companies for more than 11 years. Despite slightly disappointing economic numbers seen in November, virtually all the data released in December exceeded expectations. The Japanese unemployment rate declined to 2.7%, a new low for this cycle, while the number of people employed extended the rising trend seen throughout 2017.

In December, the Reserve Bank of Australia (RBA) said the local economy was growing around its trend rate of 3%, with employment and investment strengthening. Activity was being supported by low interest rates and public investment in infrastructure. The RBA said one continuing source of uncertainty, however, was the outlook for household spending, with income growth slow and household debt levels remaining high.

The Bloomberg Commodities index pushed ahead +4.7% in the fourth quarter, underpinned by a rally in industrial metals and energy. Nickel (+22%) and copper (+12%) and iron ore (+12%) posted the strongest gains as Chinese demand remained firm. In the energy sector, Brent crude surged +18.2%, driven by an agreement among OPEC, and non-member countries such as Russia, to extend production cuts throughout 2018.

Great share tips for 2018 - It's a myth!

The year’s winding down, so in the financial world that can only mean one thing – forecasts for next year.

Every mainstream media outlet will be putting them together over the next month because A. people like lists; and B. they’re easy to string together. The thing to always keep in mind: they’re all worthless. There’s no value that could be gleaned from forecasters who don’t own working time machines or crystal balls.

The fun part comes from looking back because picks and forecasts are mostly made with impunity. There are so many of them that rarely does anyone ever gets held to account. So a few of the clangers should always be highlighted to remind investors not to pay them any attention.

This time last year the Australian Financial Review published a 5000+ word opus: “The Best Choices for 2017: Equities”. Surprisingly, despite suggesting it was important to pick carefully in the year ahead, for the most part the article didn’t offer up many picks.

It did allow analysts and managers to muse on the general prospects for various sectors in the year ahead: retail, infrastructure, energy, technology, healthcare, agriculture, mining, property and banks. It named companies expected to do well, but mostly stopped short of offering outright recommendations.

However, in retail, while consensus was the sector would be subdued the suggestion was there would be some winners and losers. Leading to some necks being stuck out with explicit buy and sell calls made by Citigroup and UBS. With those names collected it’s time to see how well they’ve performed in 2017.

The buys were Myer, Harvey Norman, JB HiFi and Super Retail Group. The sells were Woolworths, Metcash.

How’d they fare? As the chart shows, had you done the opposite of all their recommendations you would have enjoyed a much better return than actually doing as they said. The four companies they recommended as buys went into the red by a minimum of 16%, while the two sells gave positive returns.

2017 Stock Performance.jpg


From the buys, Citigroup was most positive on Myer, noting “we expect to see better operating margins and positive sales trends even with the sluggish [consumer spending] backdrop.” Yet it was the worst of the bunch, having fallen 47% year to date.

While the sell on Woolworths from UBS was reliant on the idea that price competition from food retailers may turn into a full-blown price war. In other words, a forecast on a possibility. Not exactly the most robust way to invest.

Many of the forecasting articles follow a similar formula. It’s always based on a perverted understanding of diversification. Where the investor needs to have a grab bag of shares from various industries. List each sector of the economy and pick the companies ‘most likely to succeed’ and because you’ve got a bit of everything, you’re diversifying, right?

True diversification spans asset classes and countries. It’s not reliant on whether Woolworths gets into a price war with Coles and Aldi, meaning your retail exposure should be elsewhere for that year. It allows you to remove your focus away from your portfolio and onto your life.

For the media though, they need your eyes, while the analysts and brokers need you churning for commission. So what you won’t find in the best choices for 2018 is the recommendation of a portfolio tailored to your needs with a minimum 10 year horizon.